Display

General

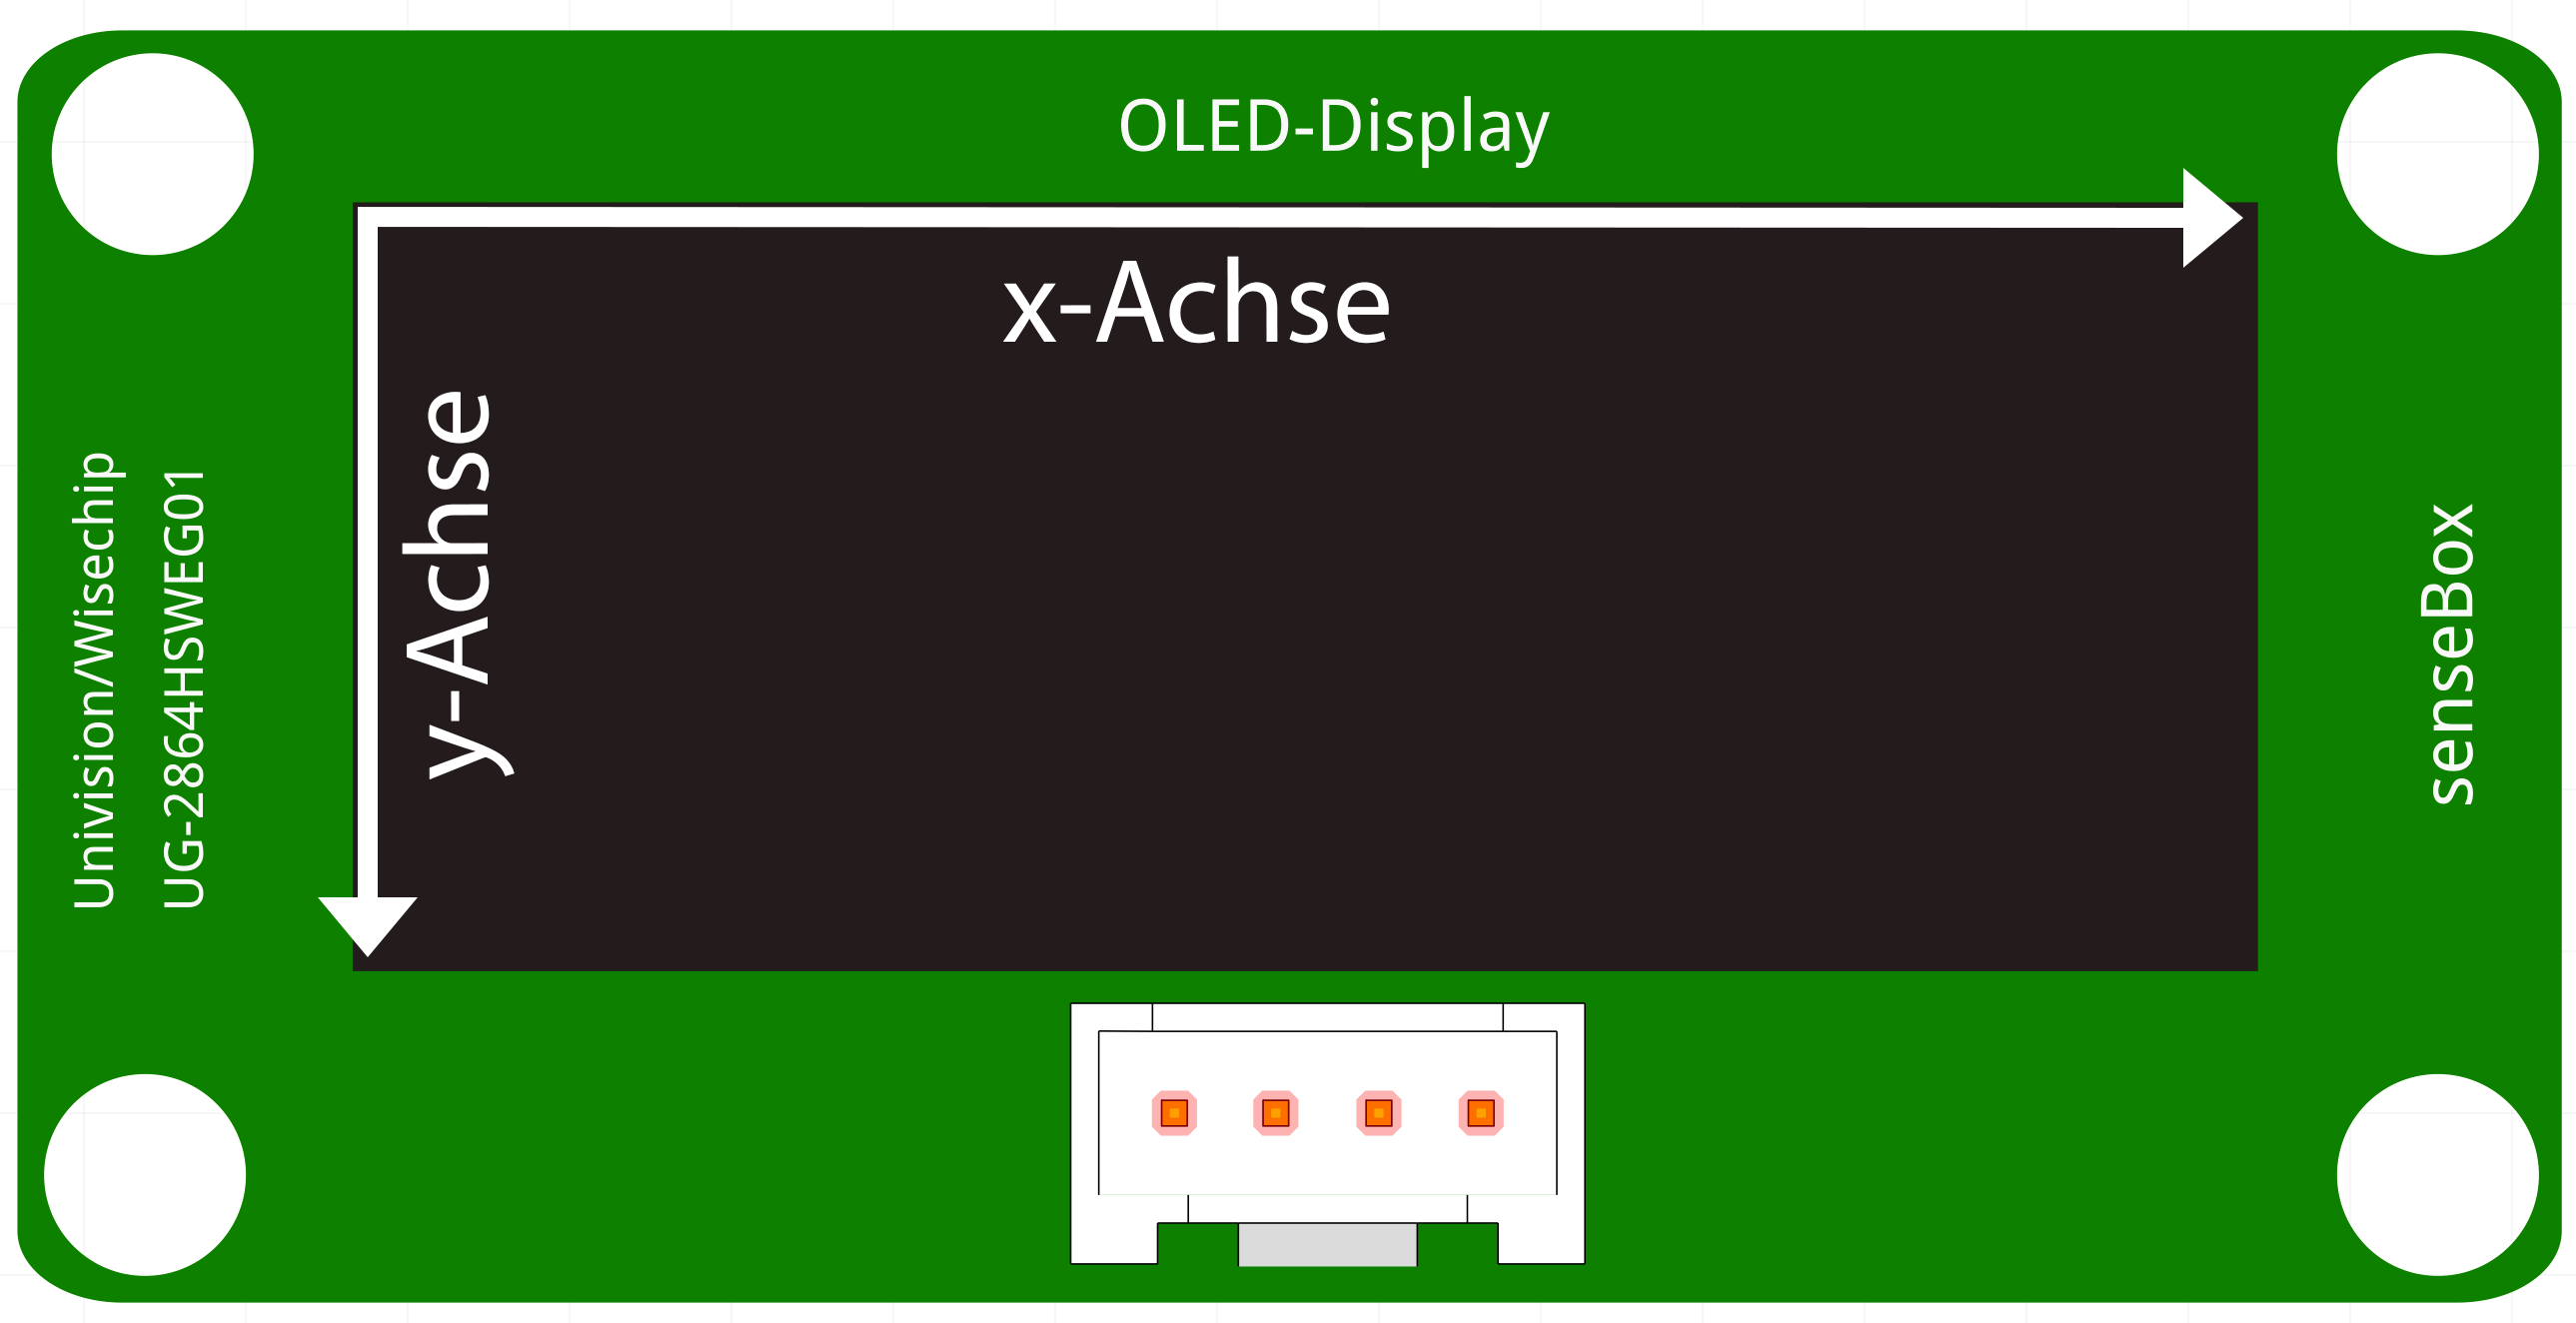
An OLED display is included in the senseBox. This can be used to display text, measured values or graphs, for example. The display has a resolution of 128x64 pixels. This means 128 pixels in horizontal direction (x-axis) and 64 pixels in vertical direction (y-axis).

/images/2020-04-07-blockly-display/Display.png - Logo

To show information on the display, it must first be initialized in the ‘Setup(). Afterwards in the Endless Loop() the Show on Display loop and the Delete Display` block can be placed. In the free section of the ‘Show on Display’ block, you can then specify exactly what is to be displayed. The ‘Clear Display’ block must be added so that different information is not written on top of each other.

/images/2020-04-07-blockly-display/blockly-display-1-en.svg - Logo

Display text/number

To display text or a number, drag the ‘Write text/number’ block into the free section of the ‘Point to display’ block.

/images/2020-04-07-blockly-display/blockly-display-2-en.svg - Logo

The ‘Write text/number’ block has five setting options:

  • Here you can choose if you want to write with white font on black background or with black font on white background.
  • Font size: Here you can choose in which size your text or number should be displayed. In font size 1 a character is 8 pixels high, in font size 2 already 16 pixels.
  • x-coordinate: Here you can define at which x-coordinate (see figure above) you want to start writing.
  • y-Coordinate: Here you define at which y-coordinate (see figure above) you want to start writing.
  • value: The respective text, number or measured value can be added to this free block section.
/images/2020-04-07-blockly-display/blockly-display-3-en.svg - Logo

Draw point

To display a dot on the display, drag the ‘Draw Dot’ block into the free section of the ‘Point to Display’ block.

/images/2020-04-07-blockly-display/blockly-display-4-en.svg - Logo

The ‘Draw Dot’ block has four setting options:

  • x-Coordinate: Here you define at which x-coordinate (see figure above) the point should be drawn.
  • y-Coordinate: Here you define at which y-coordinate (see figure above) the point should be drawn.
  • Radius: Here you can define the radius of the circle in pixels. Filled: By checking or unchecking this box you can define whether your point should be filled, i.e. completely white, or only its outline should be drawn.

Draw rectangle

To display a rectangle on the display, drag the ‘Draw rectangle’ block into the free section of the ‘Point to display’ block.

/images/2020-04-07-blockly-display/blockly-display-5-en.svg - Logo

The ‘Draw rectangle’ block has four setting options:

  • x-coordinate: Here you define at which x-coordinate (see figure above) the rectangle should be drawn.
  • y-Coordinate: Here you define at which y-coordinate (see figure above) the rectangle should be drawn. Width: Here you can define the width of the rectangle in pixels.
  • Height: Here you can define the height of the rectangle in pixels. Filled: By checking or unchecking the box, you can specify whether your rectangle should be filled, i.e. completely white, or only its outline should be drawn.

Draw diagram

To draw a diagram in real time from measured values, drag the ‘Draw Diagram’ block into the free section of the ‘Point to Display’ block. By default, the x-axis shows the time and the y-axis shows your selected measurement.

/images/2020-04-07-blockly-display/blockly-display-6-en.svg - Logo

The ‘Character Diagram’ block is the most extensive block in the ‘Display’ category. It has eleven setting options:

  • Title: In the text field attached here you can enter the title of your diagram.
  • Y-axis label: In the text field attached here you can enter the label of the y-axis.
  • X-axis label: In the text field attached here you can enter the label of the y-axis.

Attention: The longer your labels are on the x- and y-axis, the less space is left for the actual diagram. Try to limit your labels to the formula symbols (e.g. T for temperature)

  • X value range start: Here you define the start of the value range of the x-axis.
  • X-Range End: Here you define the end of the value range of the x-axis.
  • Y value range start:** Here you define the start of the value range of the y axis.
  • Here you define the end of the value range of the y-axis.

Tip: You do not have to change anything in the value range of the x-axis for a standard diagram, which records a measured value against time. You should adjust the value range of the y-axis depending on the measured value.

  • X-line distance: Here you define the distance of the auxiliary lines on the x-axis.
  • Y line distance: Here you define the distance of the auxiliary lines on the y-axis.

Hint: With a value of 0, no help lines are drawn.

  • Time interval: Here you define the time interval after your diagram is deleted and started again. Normally, this value should always be equal to the end of the x-range of values.
  • Value: The respective sensor whose measured value is to be plotted on the y-axis can be linked to this free block segment.
/images/2020-04-07-blockly-display/blockly-display-7-en.svg - Logo

In this example the temperature is plotted against time. Every 5 seconds an auxiliary line appears and after 15 seconds the diagram is cleared and restarted because the display is full

×

Subscribe

The latest tutorials sent straight to your inbox.